Environment analytics
Analytics is a KPI page for an environment: it shows how the environment is used. It is available to Administrators and Owners.
To open it, go to Organization settings > Environments, select the environment, then click Analytics.
User KPIs
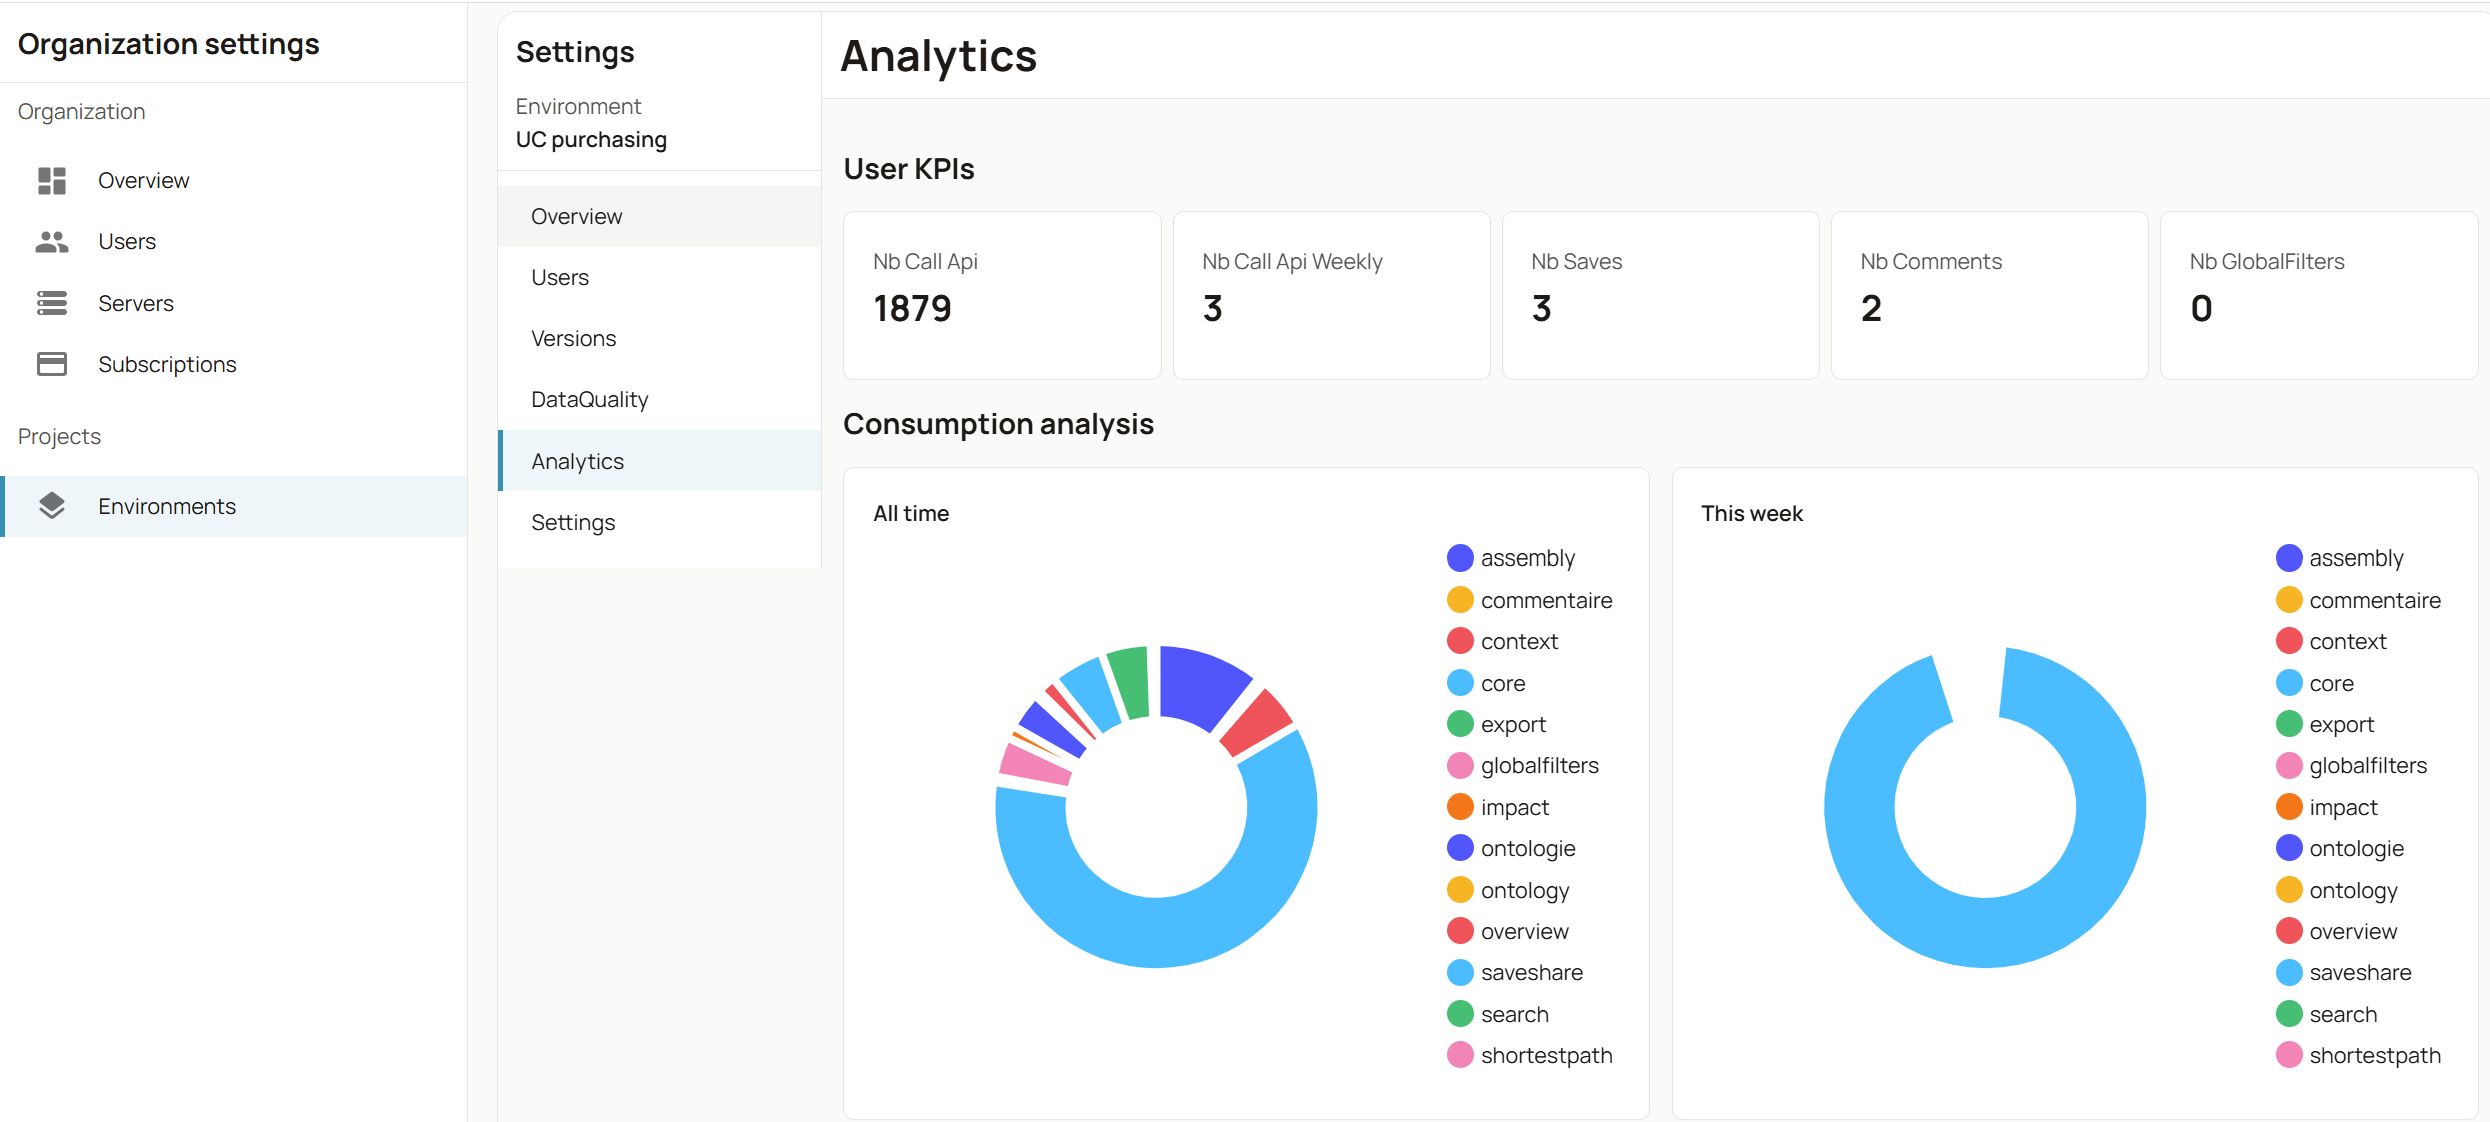
Five figures at the top of the page summarize the usage of the environment:
| KPI | What it counts |
|---|---|
| Nb Call Api | Total number of calls made in the environment since its creation |
| Nb Call Api Weekly | Number of calls made this week |
| Nb Saves | Number of saves (visualizations, views) |
| Nb Comments | Number of comments |
| Nb GlobalFilters | Number of global filters created |
Consumption analysis
Two donut charts show which features are used: one for All time, one for This week. Each slice is a type of call (for example search, shortest path, impact or export). The bigger the slice, the more that feature is used.
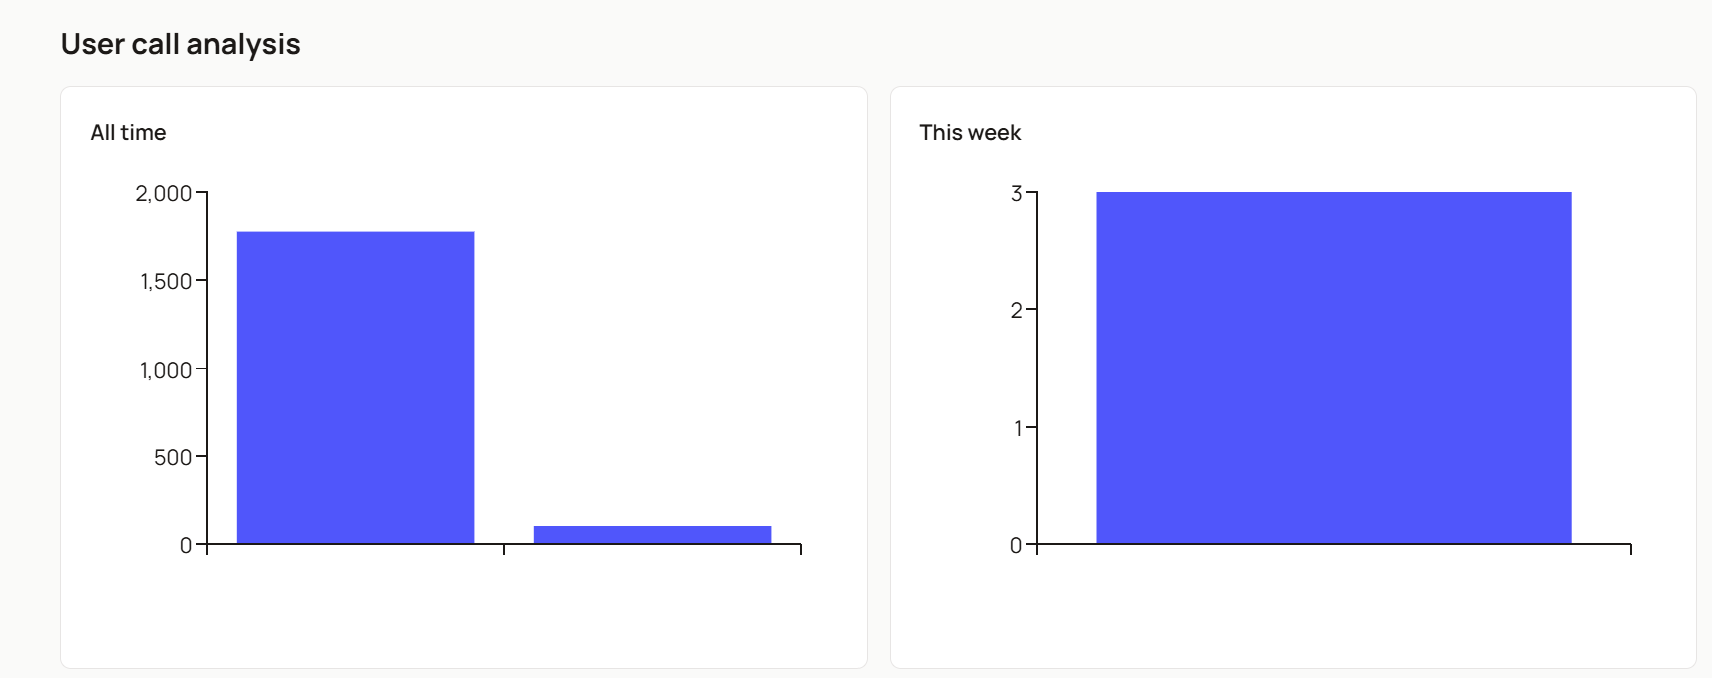
User call analysis
Two bar charts show the number of calls made by users: one for All time, one for This week.